How to Create a 3D Map with Mapbox and KNIME
Lately I’ve been exploring how to create a 3D map with Mapbox and automate certain tasks with KNIME to visualize geolocated data. The goal is to process thousands of GPS points and provide them with elevation information without writing a single line of code.
The Challenge and Starting Data
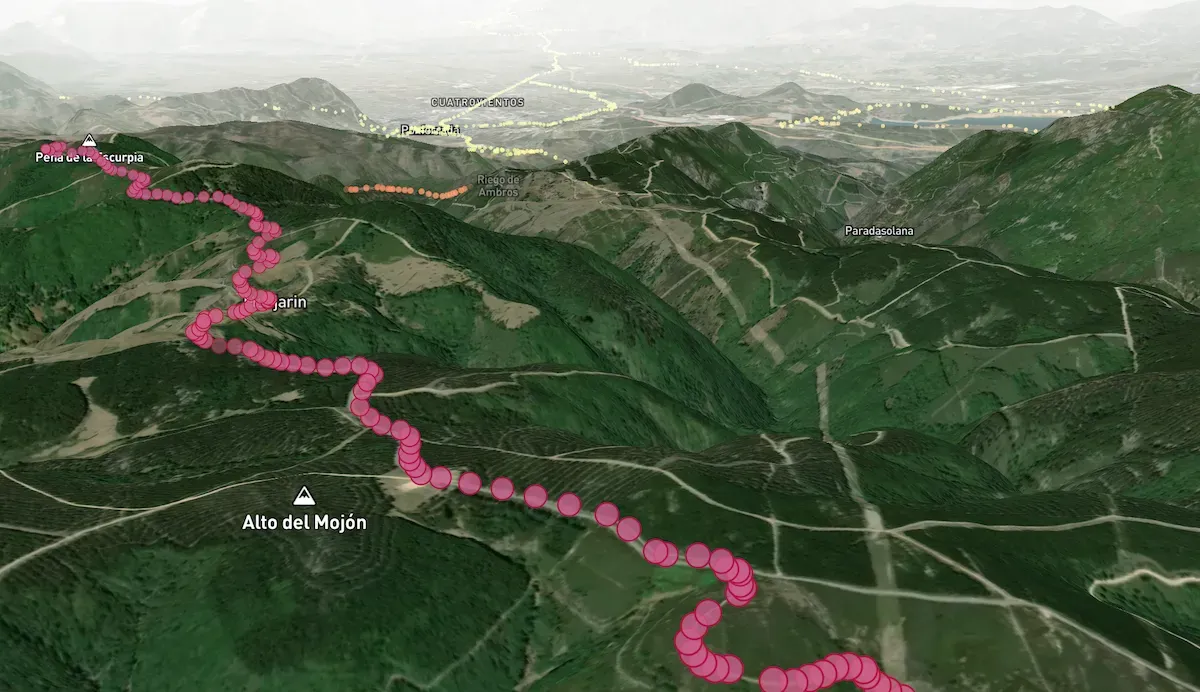
As a Camino de Santiago enthusiast, I wanted to visualize the complete topography of the peninsular routes. To do this, I used:
- CNIG GPX: 1,015 individual files with the stages of all the Caminos.
- KNIME: For data unification and enrichment (ETL).
The Problem: Incomplete Elevation Data
When unifying the more than 398,000 GPS points, I discovered that many lacked elevation data. To solve this, I used the Open-Elevation API.
Implementation in KNIME
I designed a workflow that automates queries to the API:
- Filtering: Identification of points with null elevation or errors.
- Chunking: Grouping into blocks of 1,000 points to optimize POST requests.
- API Request: Using
POST RequestandJSON Row Combinernodes to get the data in less than 4 minutes.

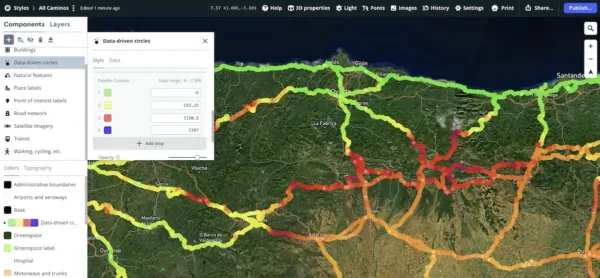
Visualization and Mapbox Studio
Once the data was enriched, the next step was 3D rendering in Mapbox Studio:
- Tileset: Importing the CSV with latitude, longitude, and the new elevation column.
- Style: Creating a map with the “Terrain 3D” layer.
- Data-driven Styling: Adjusting the color of the points based on their height above sea level.
Integration on the Web
To embed the map and include interactivity (pop-ups on click), I used the Mapbox GL JS SDK. Here is a summary of the necessary code:
mapboxgl.accessToken = 'YOUR_TOKEN';
const map = new mapboxgl.Map({
  container: 'map',
  style: 'mapbox://styles/your-user/your-style',
  center: [-8.324828, 42.566433],
  zoom: 7.1
});

map.on('click', 'point-layer', (e) => {
  new mapboxgl.Popup()
    .setLngLat(e.features[0].geometry.coordinates)
    .setText(e.features[0].properties.description)
    .addTo(map);
});
Conclusion
This project demonstrates that combining No-Code tools like KNIME and powerful services like Mapbox allows you to create professional data visualizations without needing to be a software developer.
You can download the full workflow from the KNIME Hub.